

Arguments about the Troubles are rarely short of assertions. What is often harder to find is a clear picture of the underlying numbers.
The new Salus Archive: IRA-Attributed Fatal Incidents 1969–2001 graphic series attempts to provide one.
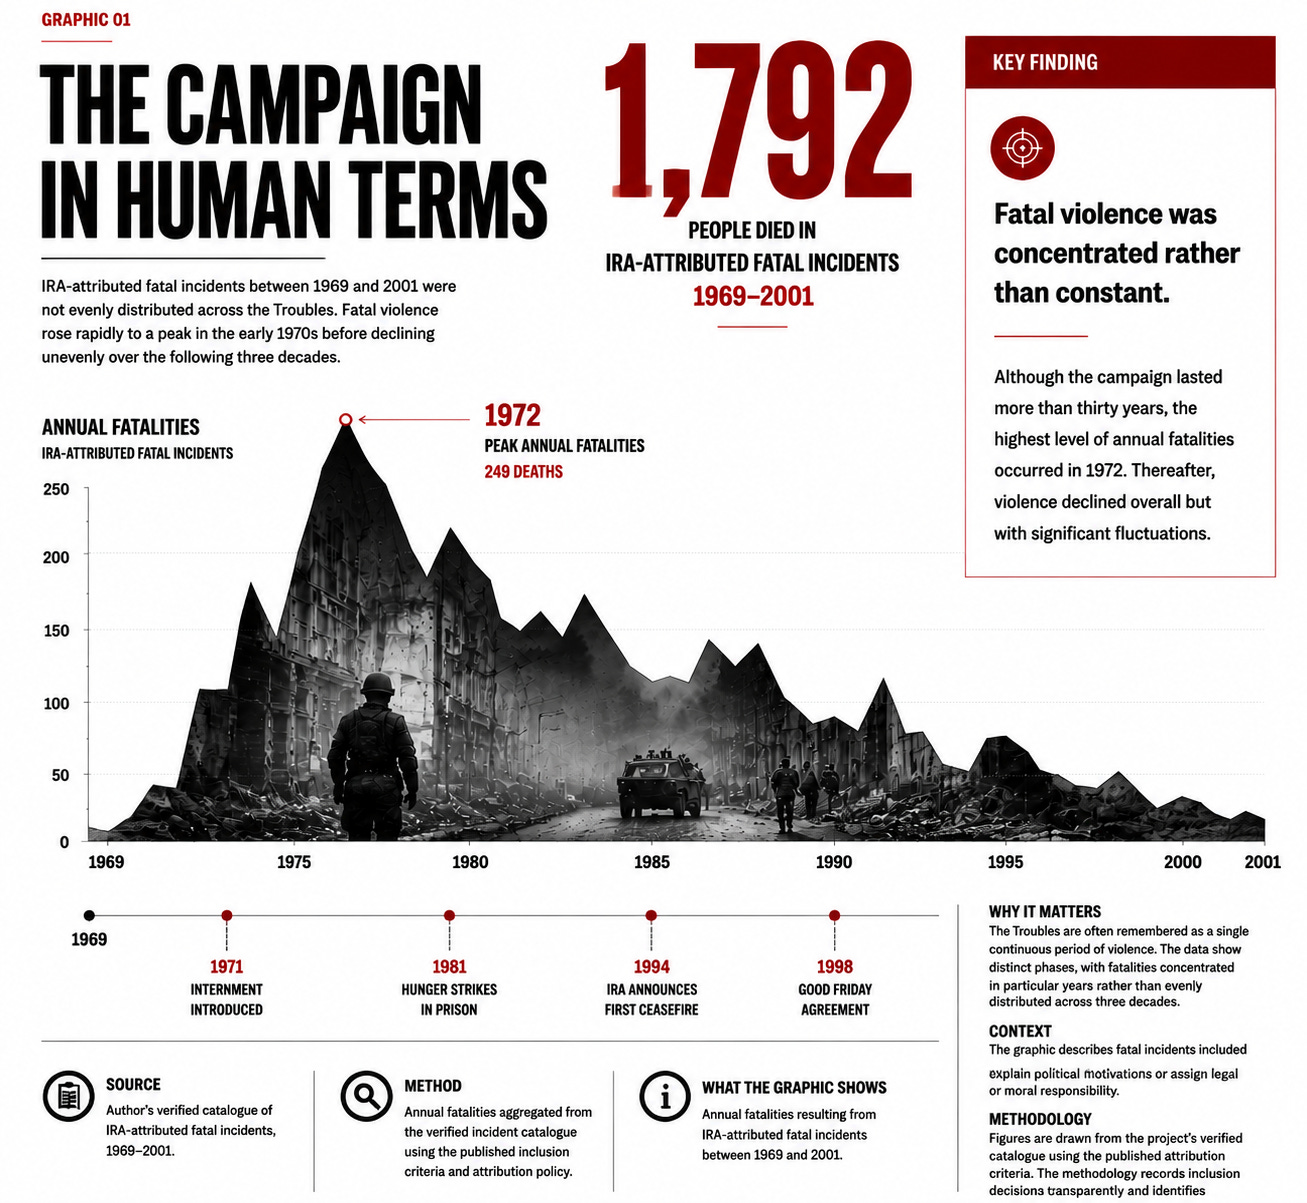
Using a verified catalogue of 1,302 fatal incidents involving 1,792 deaths, the series asks a set of straightforward questions:
How many people died, and when?
How quickly did the death toll accumulate?
Who died?
Where did fatal attacks take place?
How were people killed?
Which years were the deadliest?
How did the pattern of violence sit alongside political developments?
Which organisations were responsible?
The figures reveal patterns that can easily disappear when three decades of violence are compressed into a single historical narrative.
Fatal violence was not constant. 1972 alone accounted for 249 deaths, while the ten deadliest years accounted for 1,106 deaths — 61.7% of the total. Nine of those ten years were in the 1970s.
Nor was the campaign geographically confined to Northern Ireland. While 1,636 deaths occurred there, another 119 occurred in Great Britain, with further fatalities in the Republic of Ireland and continental Europe.
Statistics have limits.
They can show trends, geography, timing, fatalities and victim categories. They cannot establish motive, legitimacy, individual guilt, moral judgement or personal experience.
That distinction matters.
The purpose of this work is not to suggest that a spreadsheet can explain the Troubles. It cannot. Nor does putting political events alongside fatality figures establish that one caused the other.
What the numbers can do is establish a firmer evidential foundation for discussion.
The long downward trend in deaths raises an important historical question. To what extent did the increasingly intelligence-led security response reduce the IRA’s capacity to kill? The statistics cannot answer that question by themselves, but the pattern is consistent with an argument that deserves examination against the operational and historical record.
Behind every number was an individual. The statistics help us understand the scale and pattern of what happened; they do not replace the human stories.
The full 12-page graphic series is now available from SalusArchive.com
About Salus Archive
Salus Archive is an independent archival and documentary initiative dedicated to preserving operational testimony, institutional memory and long-term lessons emerging from Operation Banner and its aftermath.